The years 2015-2016 brought a breakthrough in the Business Intelligence area of SAP – starting with the launch of a new tool for data visualization and ending with the creation of a completely new system in the Data Warehouse category. New market trends, as well as more and more frequent use of cloud computing by enterprises, resulted in a change in SAP’s approach to BI tools. The completely new SAP Analytics Cloud mentioned above was designed to not only fully consolidate the functionalities of all SAP tools from the BusinessObjects and Business Explorer families, but also to facilitate access to data visualization for enterprises, while minimizing the cost of use (the SaaS model). The constantly increasing amount of incoming data, including streaming data, prompted SAP to create SAP BW/4HANA, a new system independent of the standard SAP BW system.
Apart from novelties that are just establishing themselves on the market of Business Intelligence solutions, we will also discuss SAP BI solutions that have already been present on the market, as well as their intended use in the context of specific needs of the company.
Without additional servers
Starting with SMEs, without installing additional servers, the reporting process can be carried out in two ways:
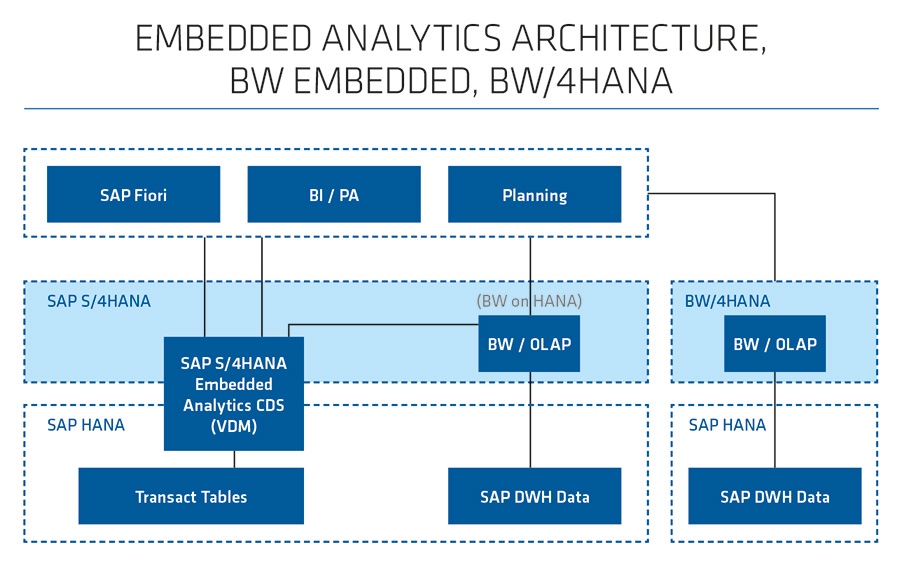
- Embedded Analytics (Core Data Services)
With a wide set of predefined database views, you can carry out the reporting process in the transactional system and receive business information in real time. No additional license fee beyond the standard S/4HANA package is charged for the use of Core Data Services (CDS). Created reports can be shared using available Fiori applications.
- Embedded BW
A fully fledged SAP BW Data Warehouse system, version 7.5, powered by SAP HANA, embedded on the transactional system server. It reduces IT architecture maintenance costs and does not entail any additional license costs. It also allows you to use a business planning tool, such as SAP BPC or SAP Integrated Planning.
What about SAP BW/4HANA?
Of course, the aforementioned companies can use a separate OLAP analytical system – SAP BW/4HANA – to support their comprehensive reporting process. SAP BW/4HANA is an innovative solution for data warehouses. Its purpose is to support customers who want to integrate operational sources of SAP data from transactional systems. Combined, cleaned and transformed data with an added semantic layer can then be used in different ways (as tools for end-users or transmitted to third party applications), providing new business insights and presenting a complete picture of them. Close integration with SAP solutions, a wide range of further connectivity options and the computing power of the HANA in-memory database make BW/4HANA stand out significantly from other SAP solutions. SAP BW/4HANA is offered both on-premise and in the cloud. It is an ideal product for all organizations and industries looking for the solution including a data warehouse. Data collected from many sources, standardized, and with common semantics is the only version of truth and a big step towards a data-driven business. The use of an innovative database, entirely residing in RAM, significantly increases the speed of data processing. The use of the widely known Eclipse environment instead of SAP GUI (SAP NetWeaver) makes the system management even easier. Despite the fact that SAP BW/4HANA is a back-end tool for enterprise reporting, the generated business value is noticeable mainly on the central level. It is cheaper and easier to manage one centralized business data warehouse with the performance achieved through the use of the HANA database. Separating analytics from the transactional environment will contribute to reducing the workload of the latter. SAP BW/4HANA increases the customer’s independence by giving context to transactional data and performing a complex analysis during the automation and improvement of analytical processes at the same time. The streamlined architecture in the form of a limited number of BW objects helps to shorten the design time, reduce the schedule of data loading and limit data redundancy. With BW/4HANA, SAP has put the emphasis on virtual data modeling. Thanks to the Smart Data Integration (SDI), data transfer is no longer required. This enables real time reporting, which can be particularly helpful during the month-end closing. With BW/4HANA, SAP introduces a more visually attractive tool for administrators. All activities are carried out in the HANA Studio based on Eclipse, including Query Designer.
Three in one
With properly prepared data in place, it is worth taking a closer look at reporting options. The aforementioned SAP Analytics Cloud (SAC) is a unique solution in a wide range of SAP analytical products, created on the basis of a model that uses cloud computing through remote access to applications (Software-as-a-Service). SAP Analytics Cloud is the only tool in the SaaS model that combines all three analytical functionalities available on the market: reporting, planning and prediction. Cloud computing gives you unprecedented flexibility – the ability to quickly adapt your computing power to the current needs of your business. What’s more, it allows you to connect to various types of data sources (such as SAP BW, BPC or SQL database). All companies and organizations can benefit from this comprehensive solution, no matter what kind of challenges they face on a daily basis. SAP Analytics Cloud is an ideal tool especially for existing customers operating locally, who want to transform their business into a more independent and generally accessible one (thanks to the transition to the cloud). SAC offers a wide range of analytical capabilities and technical functionalities that are key to improving decision making and business management. Despite many questions and doubts, especially in the area of data security, moving the business to the cloud creates a new trend and market niche. Considering the fact that so far SAP has been the only provider offering a reliable and effective product, SAP Analytics Cloud has incredible potential in the field of data exploration, analysis and visualization. The customer receives a comprehensive solution that combines three fundamental analytical functionalities: Business Intelligence, planning and prediction. With SAP, you do not have to worry about the security of data stored in a cloud-based system, as it is hosted in certified data centers whose reliability is confirmed by the compliance with various ISO standards. Data centers must comply with very strict rules to ensure that all actions are taken with great care and to prevent data leakage or theft. The SAP Analytics Cloud interface is very intuitive and user-friendly, which is very helpful during everyday use of SAC. It accelerates not only the whole process of learning new features, but also significantly improves the decision-making process in the company.
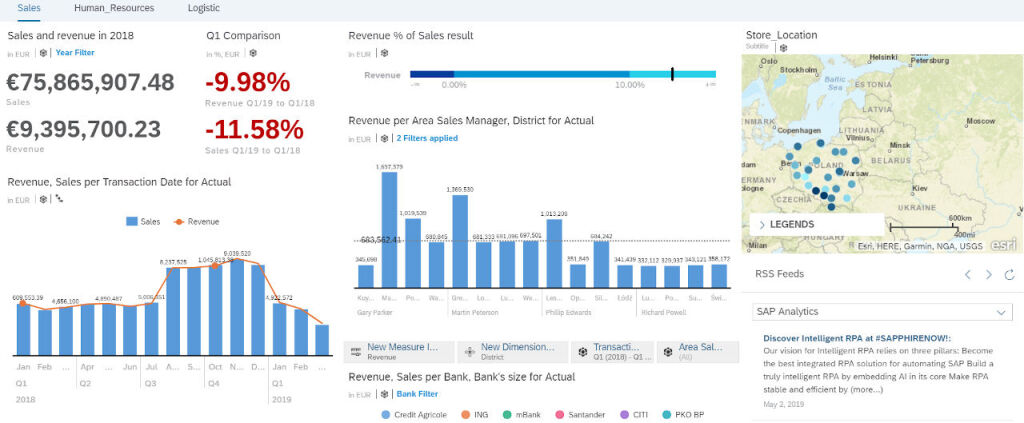
SAP Analytics Cloud – management cockpit combining data from many areas of the company
What are other options?
Apart from the cloud tool described above, SAP still offers other tools from the Business Explorer or BusinessObjects families. When the standard Excel is a sufficient tool for analysts working in the company, it is worth considering the implementation of SAP BusinessObjects Analysis for Office (AfO). It is an interactive analytical tool for daily operational and analytical reporting, based on data residing in the SAP Business Warehouse (SAP BW) or SAP S/4HANA (or the HANA database in general). It enables business analysts to not only conduct a multidimensional data analysis in the familiar Microsoft Excel environment, but also to integrate with MS PowerPoint or MS Word in order to present the results of the analysis. This tool allows you to extend the capabilities of Microsoft Excel to get an immediate picture of the situation, regardless of the amount of data being processed. SAP AfO can be used in all types of business operations where data from SAP systems is expected to be reported in Excel. AfO can be used not only to report finances or controlling, but also to present activities across all departments, such as warehouse management and human resources. If the first question for end users is “can we export it to Excel?”, the implementation of AfO is the best way to meet their needs. Through AfO, financial analysts of the enterprise and other business users can quickly access, visualize and analyze data from SAP systems. The drag-and-drop user panel interface allows users to quickly filter, browse across different sections, drill and manipulate dimensions to discover business from a previously unseen perspective. You can drill into a document item or navigate between reports, providing a specific parameter (such as a material or document number).
SAP AfO is a successor to BEx Analyzer (which was part of the NetWeaver BEx package) with a modern and more intuitive interface reminiscent of the Excel pivot table. If you have an SAP BW warehouse, you can still benefit from it, since AfO uses BEx queries as a report structure. An analysis performed in familiar Microsoft Office tools increases the level of performance and saves time spent on complex data processing. With AfO, the organization will be able to devote more time to becoming familiar with the source data and business logic behind the report, rather than spending it manually preparing data and endlessly pasting it between spreadsheets. The same applies to presentations in MS PowerPoint prepared for the management board, or periodic financial statements. It is possible to embed tables or charts in these documents and automatically refresh them on demand without the need for reformatting. The implementation of AfO ensures a quick return on investment and reduces overall expenses (for example, due to the lack of need for intensive training of employees thanks to the familiar Office environment). Moreover, it improves the decision-making process and minimizes financial risk by ensuring daily reporting based on reliable data delivered to business users on time.
If you want to use more comprehensive reports with a printing option, consider the tool that has been present on the market for over 15 years – SAP Crystal Reports. It is an analytical tool for designing and publishing business reports. With the ability to connect data sources such as relational databases, flat files, BW queries and non-SAP sources, Crystal Reports allows you to report data from any area of the company. Thanks to the use of interactive charts, tables and conditional formatting, pixel perfect reports offer business users a clear view of the compiled data and allow them to discover previously unnoticeable trends and relationships. The main advantage of SAP Crystal Reports is its simple and intuitive interface that allows financial analysts and managers to create ad-hoc reports, while allowing for further development of reports through the use of a complex calculation logic or display rules by advanced developers. It is also possible to integrate SAP Crystal Reports with the BI BusinessObjects platform. The combination of both solutions enables the customer to automatically generate periodic reports to the most popular formats, such as PDF or Microsoft Excel, and distribute them to mailboxes or external servers, e.g. printers.
Having described “trendy” Business Intelligence tools, it is worth mentioning Business Explorer tools, which are still offered. They include:
- BEx Query Designer, used to query the Data Warehouse and provide front-end tools with queries,
- BEx Analyzer, an overlay for Microsoft Excel that everybody knows
- BEx Web Application Designer, intended to create web applications in HTML technology.
A distinguishing feature of these tools is the fact that they are included in the standard package attached to SAP BW 7.x. They do not entail any additional license costs.
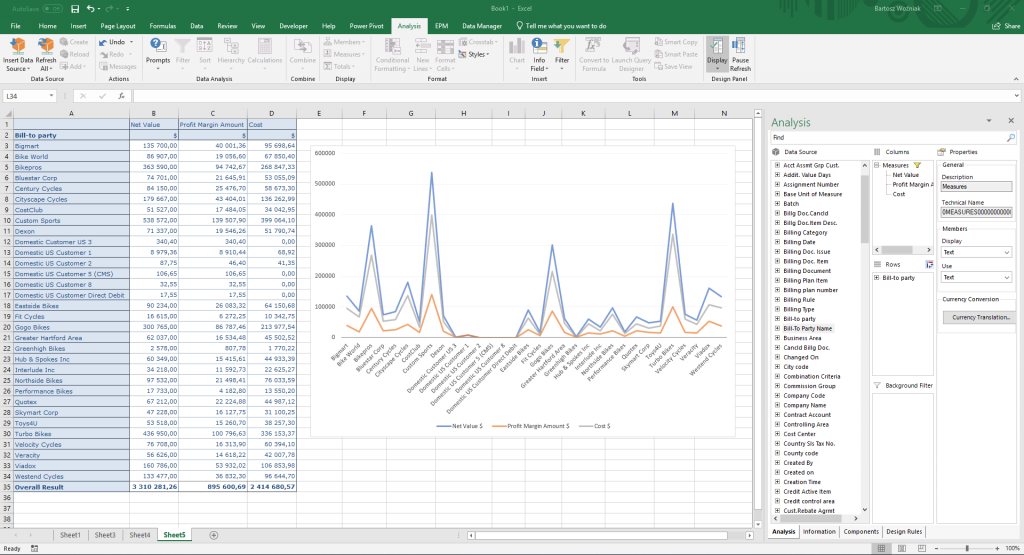
Analysis for Offi ce – analysis of receivables
Visualization
Going back to the subject of managerial dashboards – if the customer would not decide to use the SAP Analytics Cloud, they still can implement its predecessor, i.e. SAP BusinessObjects Lumira 2.0. This is a tool offered in two variants:
- SAP Lumira 2.0 Discovery, designed for business users who can implement simple dashboards themselves in order to obtain valuable business information without having technical IT knowledge,
- SAP Lumira 2.0 Designer, a tool for creating advanced, comprehensive analytical applications (with the planning option). Knowledge of technical issues is required for creating applications (HTML5, JavaScript).
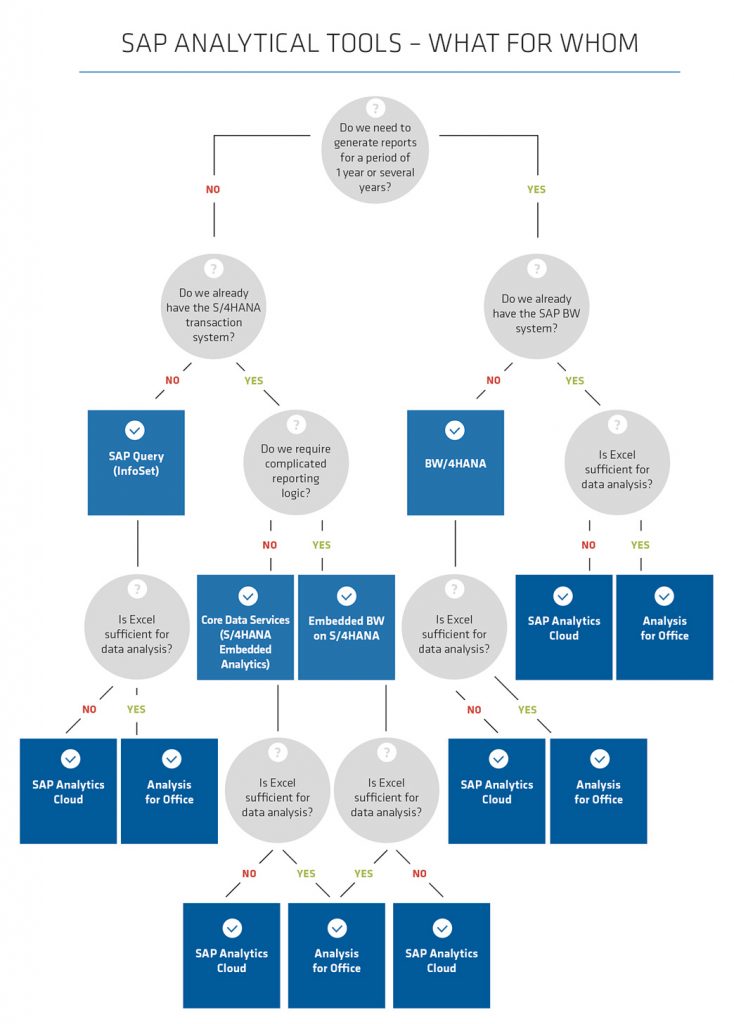
Despite the consolidation of the reporting environment in the SAP landscape, customers still have the option of choosing from already existing tools in order to be able to fully utilize the reporting capabilities. To make it easier for you to choose the tool, we have prepared a decision tree.